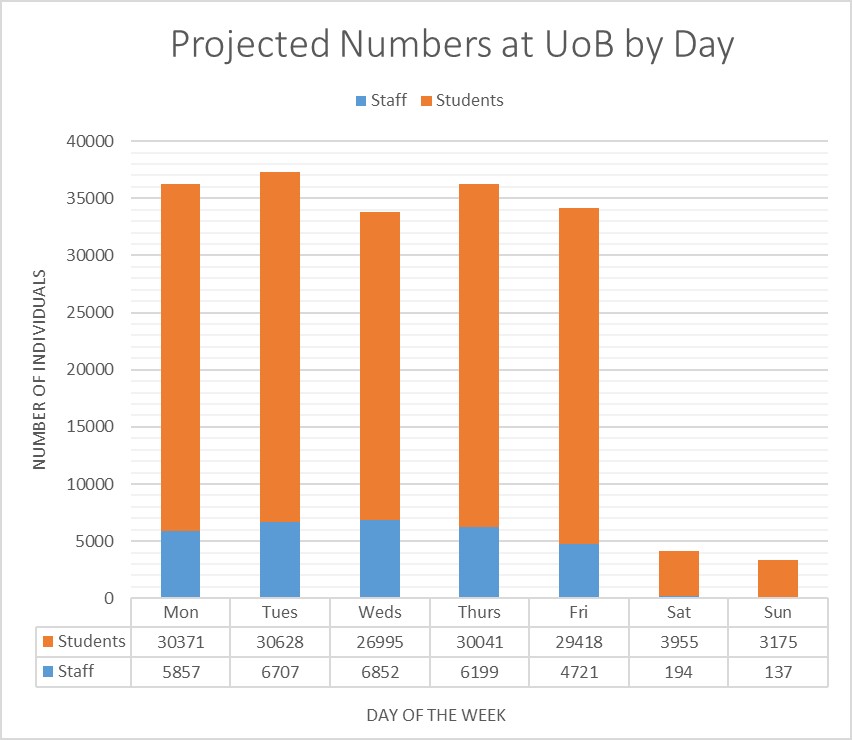
The 2022 travel survey was the first post covid. Despite the changes to work and study that the pandemic brought about, the commute is still very much a part of the lifestlye of our community. On average staff members work at UoB 3.5 days per week. Students use campus facilities more regularly—90% are on site at some point during a normal weekday. That means during the average term day there are around 35,000 staff and students on site.
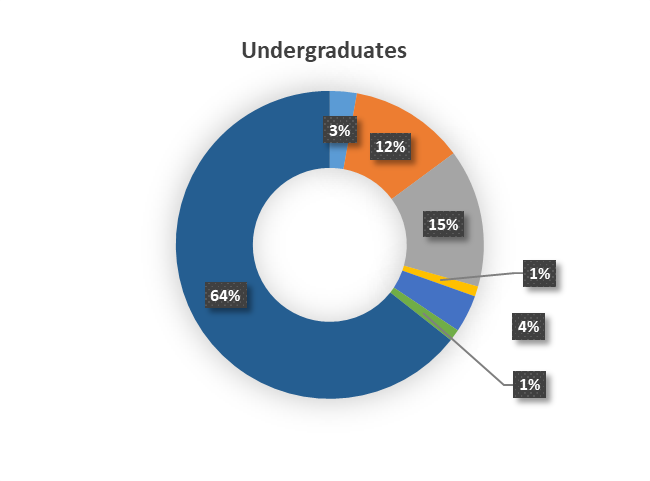
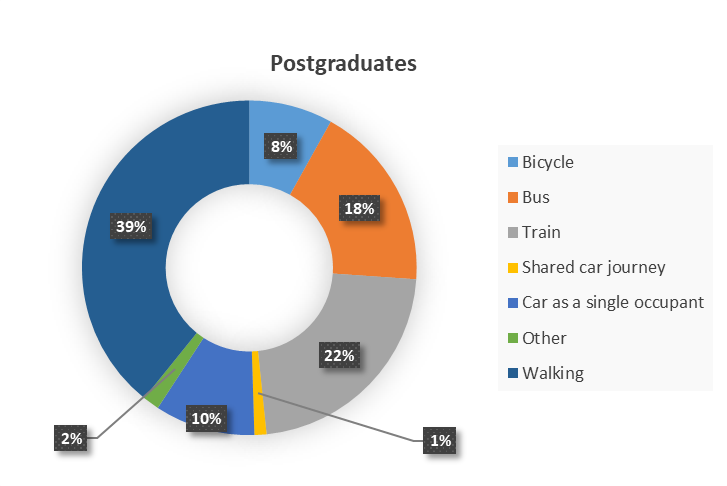
University of Birmingham is overwhelmingly an institution that travels on foot. Two in three undergraduates and two in five postgraduates walk to campus. That means over half of daily journeys to and from campus are walking journeys, not to mention the uncounted strolls to the library, lecture theatre, meeting room, shop, café and more.
|
Mode of transport
|
Projected numbers at UoB
|
% weekday population
|
|
Walking
|
18100
|
51.0%
|
|
Car as a single occupant
|
3700
|
10.3%
|
|
Shared car journey
|
770
|
2.2%
|
|
Train
|
5800
|
16.2%
|
|
Bus
|
4600
|
13.0%
|
|
Bicycle
|
2200
|
6.1%
|
That said, the survey shows more students are commuting by bus and train than before. Both modes are at all-time highs since the first travel survey 2008 and five percentage points higher than in 2018. In turn this suggests that students are living further afield, a hunch that merits further investigation. Similarly, student car driving has risen significantly in proportional terms, though it is still a minority mode and below historical figures.
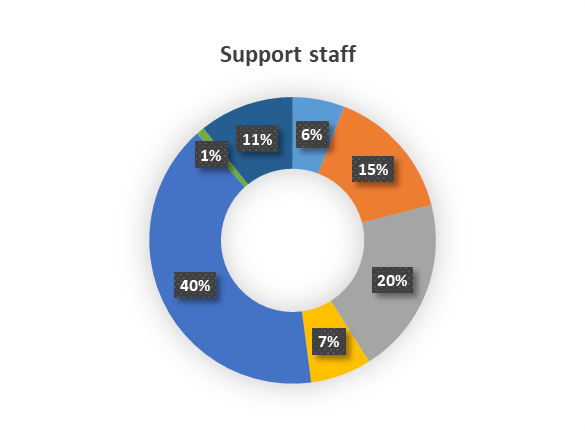
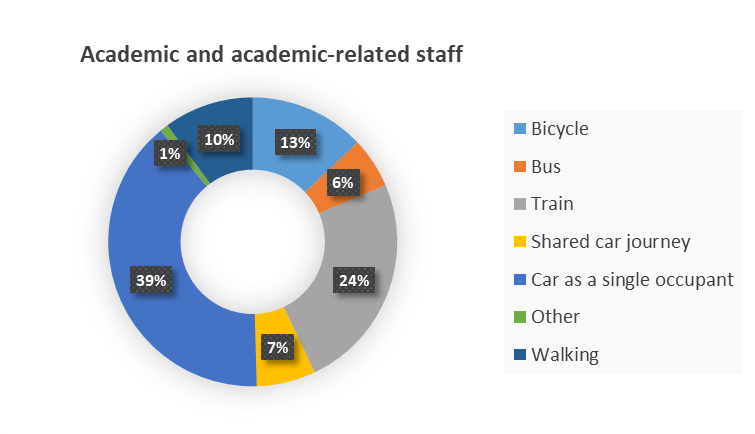
Staff solo car commuting rebounded during the pandemic to 40%, the level last seen in 2008, mainly to the detriment of car sharing and train travel. Fewer staff walk to work—and there may be pandemic stories of moving further afield at play—but more than 10% still do. Staff cycling has nudged to a record high of 11%.
The average crow-flies commuting distance is 7 km for students and 16 km for staff. As expected the average distances by mode varies considerably. Rail journeys tend to be long distance, averaging 22 km for students and 31 km for staff. Solo car journeys are a long distance option for students at 24 km on average, but an all-round option for staff—their average solo car commute of 17 km is very close to the average commute across all modes. Cycling commutes average 3.5 km. Staff walk significantly further than students, with an impressive average distance of 2.7 km, and they say they value the wellbeing benefits they gain from the time they commit to their pedestrian commute.
Commuting is responsible for over ten thousand tonnes of UoB carbon dioxide emissions at a conservative estimate, 59% from solo car journeys, 26% from train journeys and 10% from bus journeys. In proportional as well as these absolute terms, solo car journeys are the most polluting. The average emissions per kilometre per person when driving a car alone is four times greater than by train and 1.5 times greater than by bus.
|
Mode of transport
|
Aggregate annual emissions (tonnes)
|
Av. distance travelled (km)
|
Av. annual emissions per commuter (tonnes)
|
CO2e emitted per commuter km (kg)
|
|
Bicycle
|
0
|
3.1
|
0.00
|
0.00
|
|
Bus
|
1029
|
5.0
|
0.20
|
0.12
|
|
Car as a single occupant
|
6174
|
18.5
|
1.19
|
0.18
|
|
Metro
|
22
|
11.8
|
0.14
|
0.04
|
|
Motorcycle or moped
|
14
|
14.2
|
0.43
|
0.12
|
|
Shared car journey
|
502
|
10.0
|
0.54
|
0.18
|
|
Taxi
|
31
|
6.9
|
0.26
|
0.15
|
|
Train
|
2719
|
27.6
|
0.36
|
0.04
|
|
Walking
|
0
|
1.6
|
0.00
|
0.00
|
|
Grand Total
|
10491
|
11.5
|
0.26
|
|
Understanding the geography of UoB commuting is essential to understanding how to enable sustainable travel choices and is addressed in the next section.
Mapping University of Birmingham commuting